
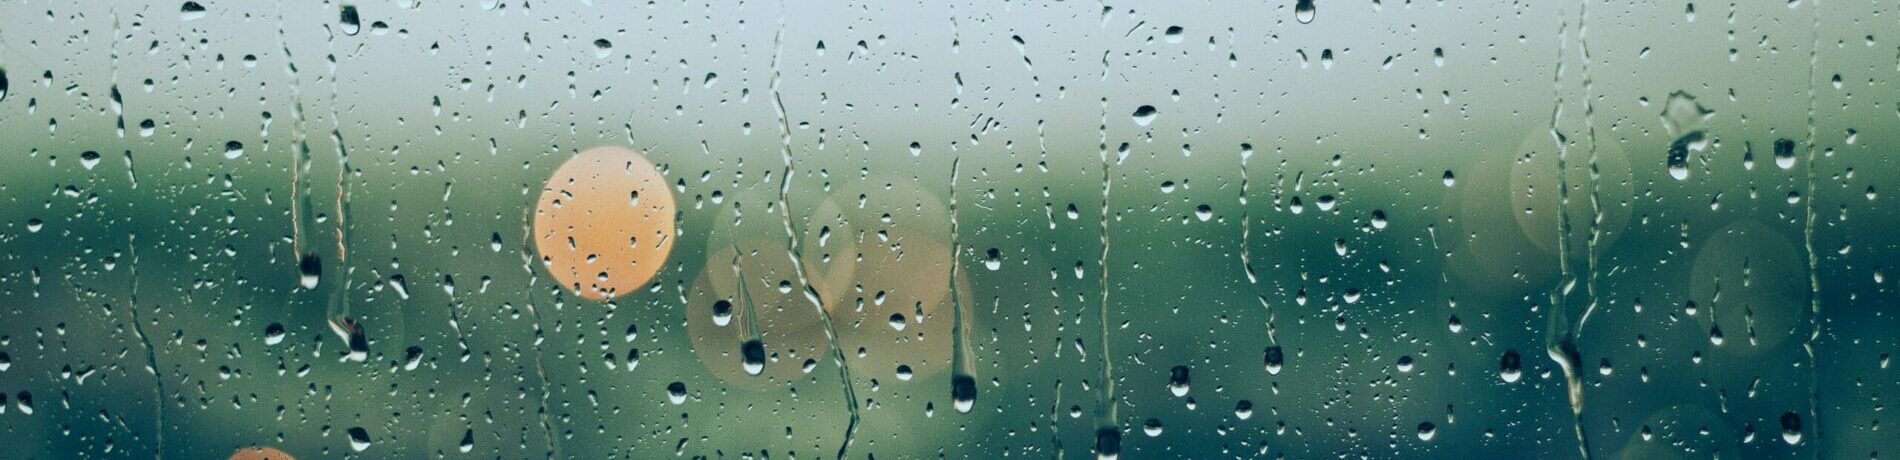
RAIN RADAR
Rain radar – your current and reliable rain forecast
What is the weather like in my region and where is it raining right now? Where and how much will it rain in the next few hours? Our rain radar answers these questions and shows you in which regions of the USA or Canada how much precipitation can be expected in the next hours.
No matter if you are planning a trip outside or just want to know if and how much it will rain in the coming hours: You can find information about the intensity and amount of the predicted precipitation on our rain radar.
The rain is displayed in color on the map. A green or blue coloring means weak to moderate precipitation. If colored violet, you should expect heavy rain.
Current rainfall in your region? – This is how you read the rain radar:
 On the rain radar, the areas where rain is predicted are displayed in color. The colors range from violet (weak precipitation) to a slightly reddish color, which indicates very heavy precipitation. Areas, where there is a risk of thunderstorms, are also visible to you on the rain radar. You can recognize these by a white “lightning symbol”. Additionally, our rain radar offers you the following functions, which simplify the rain forecast for you:
 With the cursor at the bottom left of the rain radar, you can visibly display the future course of precipitation on the rain radar. This tells you how the precipitation will change over the next 36 hours and whether you can dispense with an umbrella in the next few hours.
 Simply move the precipitation marker to your desired location with the mouse (on a cell phone: hold down the white dot of the marker with your finger) and you will see how many millimeters of precipitation will fall there in the next 12 hours.
How does a rain radar work in general?
 A radar measures the water concentration of a cloud from the ground and can thus draw conclusions about precipitation. Microwaves are sent into the clouds by a radar station and reflected by the water droplets. The more rays hit the radar station again, the more precipitation is contained in the cloud.
The major advantage of this form of measurement technique is that it produces an accurate image of the precipitation area within a few seconds. Also, it is updated at extremely short intervals (depending on the radar, sometimes second by second).
Incidentally, the cloud radar works similarly. Only the lightning strike map and storm radar differ in their mechanics and measurement technique.
How is precipitation radar created?
In the previous section, you already learned that a radar station and its radar beams can be used to measure how much water vapor is present in a cloud. In order to visualize these findings in a radar image, not only one, but several stations at different locations are needed. Only then can a concrete image of precipitation be created.
In practice, the accuracy of the measurement continuously decreases with increasing distances. This is due to the divergence of the electromagnetic beams emitted by the radar station. The divergence is understood as the continuous divergence of the radiation emitted by the station. For this reason, it is useful to spread the radar measurement stations over a wide area for an accurate precipitation image.
Which is the best rain radar or precipitation radar?
There are now many different rain and precipitation radars available on websites or as an app. There are often noticeable differences between the offerings. In the following, you will find some questions that provide information about a good precipitation radar:
✔️ Does the rainfall radar provide information about the past AND the future course of the precipitation areas? – YES
✔️ Can areas be zoomed in and out on the map, or can the radar image be zoomed in? – YES
✔️ Is the rain radar also displayed correctly on the smartphone and is it mobile optimized? – YES
✔️ Does the precipitation radar differentiate between rain and snowfall? – YES
✔️ Are thunderstorms displayed on the map in addition to precipitation? – YES
If you can answer all questions with a YES, then you know that you are dealing with a contemporary and good precipitation radar.

Rainfall radar – What does purple mean?
If you are a frequent user of rainfall radar, you will almost certainly have seen purple areas on the map. These stand out clearly among the otherwise blue colorings. Rain areas in purple signal very heavy precipitation or heavy rain.
For you as a guideline: From a precipitation amount of about 5 liters in 5 minutes per square meter one speaks of heavy rain. This is almost always accompanied by thunderstorms.
How reliable is a rain radar?
A question that is often asked in relation to a rain radar is the reliability of such a rain radar. How reliable are the forecasts that can be read from the radar? Can I trust the weather image or will I possibly even be left out in the rain?
Here we can reassure you: Due to the broadly developed network of radar stations, the forecasts of the precipitation radar are very accurate and reliable. A 100% guarantee can never be given, but the hit rate of a modern rain radar is over 95%. This is what our experience has shown.
How accurate is a rain radar?
Very accurate – Although many factors such as wind or local conditions (e.g. mountains or hills) have an influence on precipitation, today’s radar technology can calculate precipitation at a distance of up to a few hundred meters. You don’t believe that? Then just do the test yourself. Look at your precipitation radar more often in the future. The next time a rain front approaches, you can check exactly when the rain will start at your location and whether the radar image matches reality.
Why does the rain radar show precipitation although it is not raining?
In individual cases it can happen that rain areas are displayed although there is no trace of rain far and wide. We remember back: The precipitation radar gives us information about how much water (vapor) is present in a cloud at the moment. Based on the laws of physics, it is possible to calculate quite precisely when the maximum absorption level of the cloud has been reached and when it will rain off. However, in practice there may be cases where the cloud takes up a little more water vapor than calculated (for example, due to temperature or air pressure differences). For this reason, occasionally rain areas can be detected in the radar, where it is actually not raining at all.
Another reason may be that the precipitation simply does not reach the ground. It also happens that particularly fine precipitation is carried by the wind to another area or simply evaporates on its journey to earth.
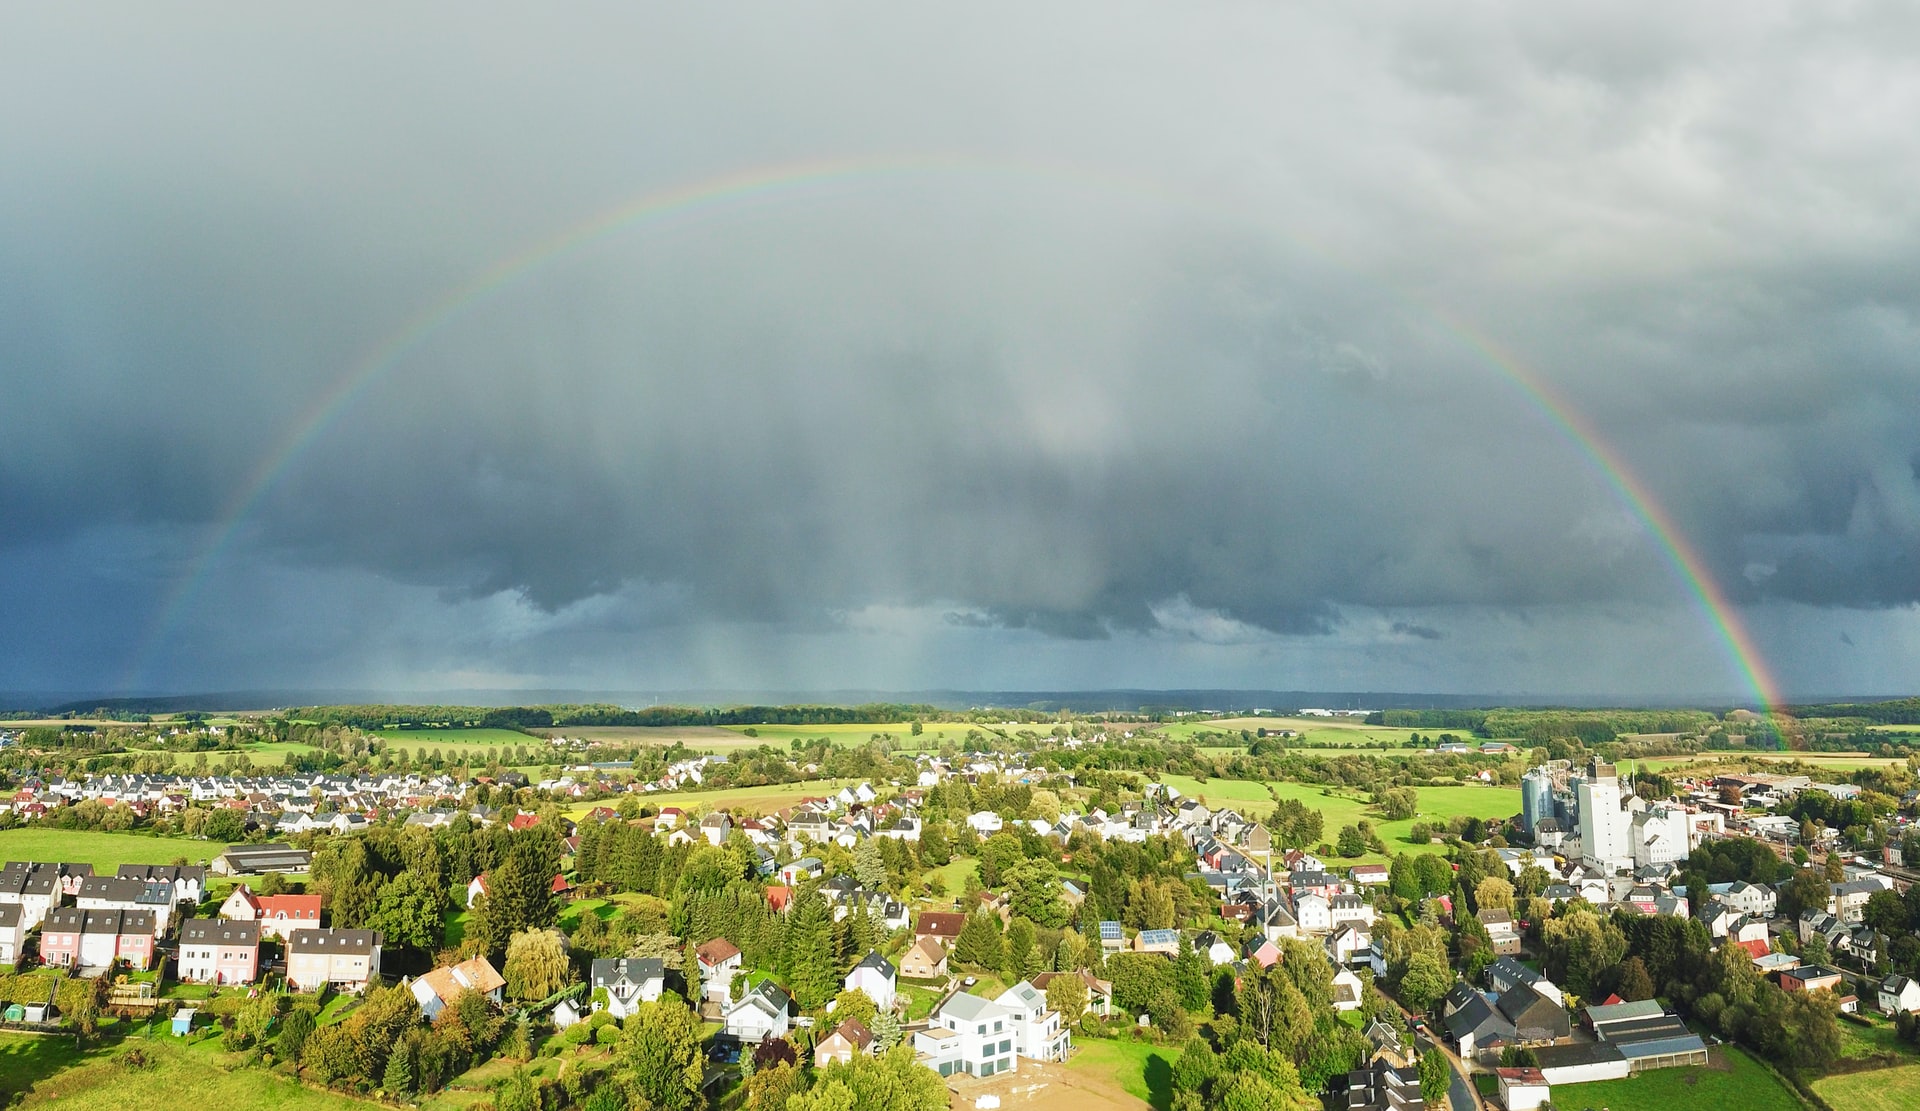
When will there be good weather again?
Another question you often hear: When will the weather finally be nice again? You can answer this question pretty easily with our precipitation radar. First, look at where exactly you are on the map. Then click on the cursor at the bottom left and observe when the rain area passed you by. You can easily read this information from the timeline located at the bottom of the precipitation map. Then, using our cloud forecast, you can check when the sun will peek through the clouds and be able to plan your next sunbath.
Interesting facts about the rain:
1759mm annually…
This is how much precipitation falls on average in the USA annually. Although this may seem like a lot to you, some cities and towns significantly exceed this value. For example, in the Colombian municipality of Lloró, it rains about 13000mm a year! You read correctly: not 1300, but 13000mm on average over the last years. Or to put it another way: in seven weeks the annual precipitation of the USA falls there.
This is where it rains the most in the USA!
12000mm annually…
You have to reckon with this amount of precipitation if you spend a year on the island of Kauai, Hawaii. So you should definitely take an umbrella with you. The annual rainfall exceeds the average by about 582%!
Here it rains the least in the USA!
Less than 101mm annually…
This is how much (or little) precipitation falls in Las Vegas throughout the year. Another record next to the hours of sunshine. The weather there literally will not leave you out in the rain. The city in Nevada is about 94% below the annual average.